Food security atlas
The map of every harvest yet to come.
Twelve agricultural regions that feed most of the world. Toggle the layer — productivity, degradation, water stress, opportunity — and see where Harvestria moves the needle most.
12 regions · live
Selected region
Sahel
Productivity index22
Soil degradation91
Water stress88
Harvestria opportunity96
Click any region. Bigger dots = higher value on the selected layer.
What happens if we do nothing?
The same century, projected forward without intervention.
A reference projection assuming current trends in soil degradation, fertilizer dependency and freshwater allocation continue at their 2010–2024 rate.
+105M ha
Additional degraded arable land by 2055
if trends hold
52%
Median import dependence by 2055
strategic crops
3.4B
People under water stress by 2050
UN projection band
−18%
Cereal yield growth, decade over decade
extrapolated
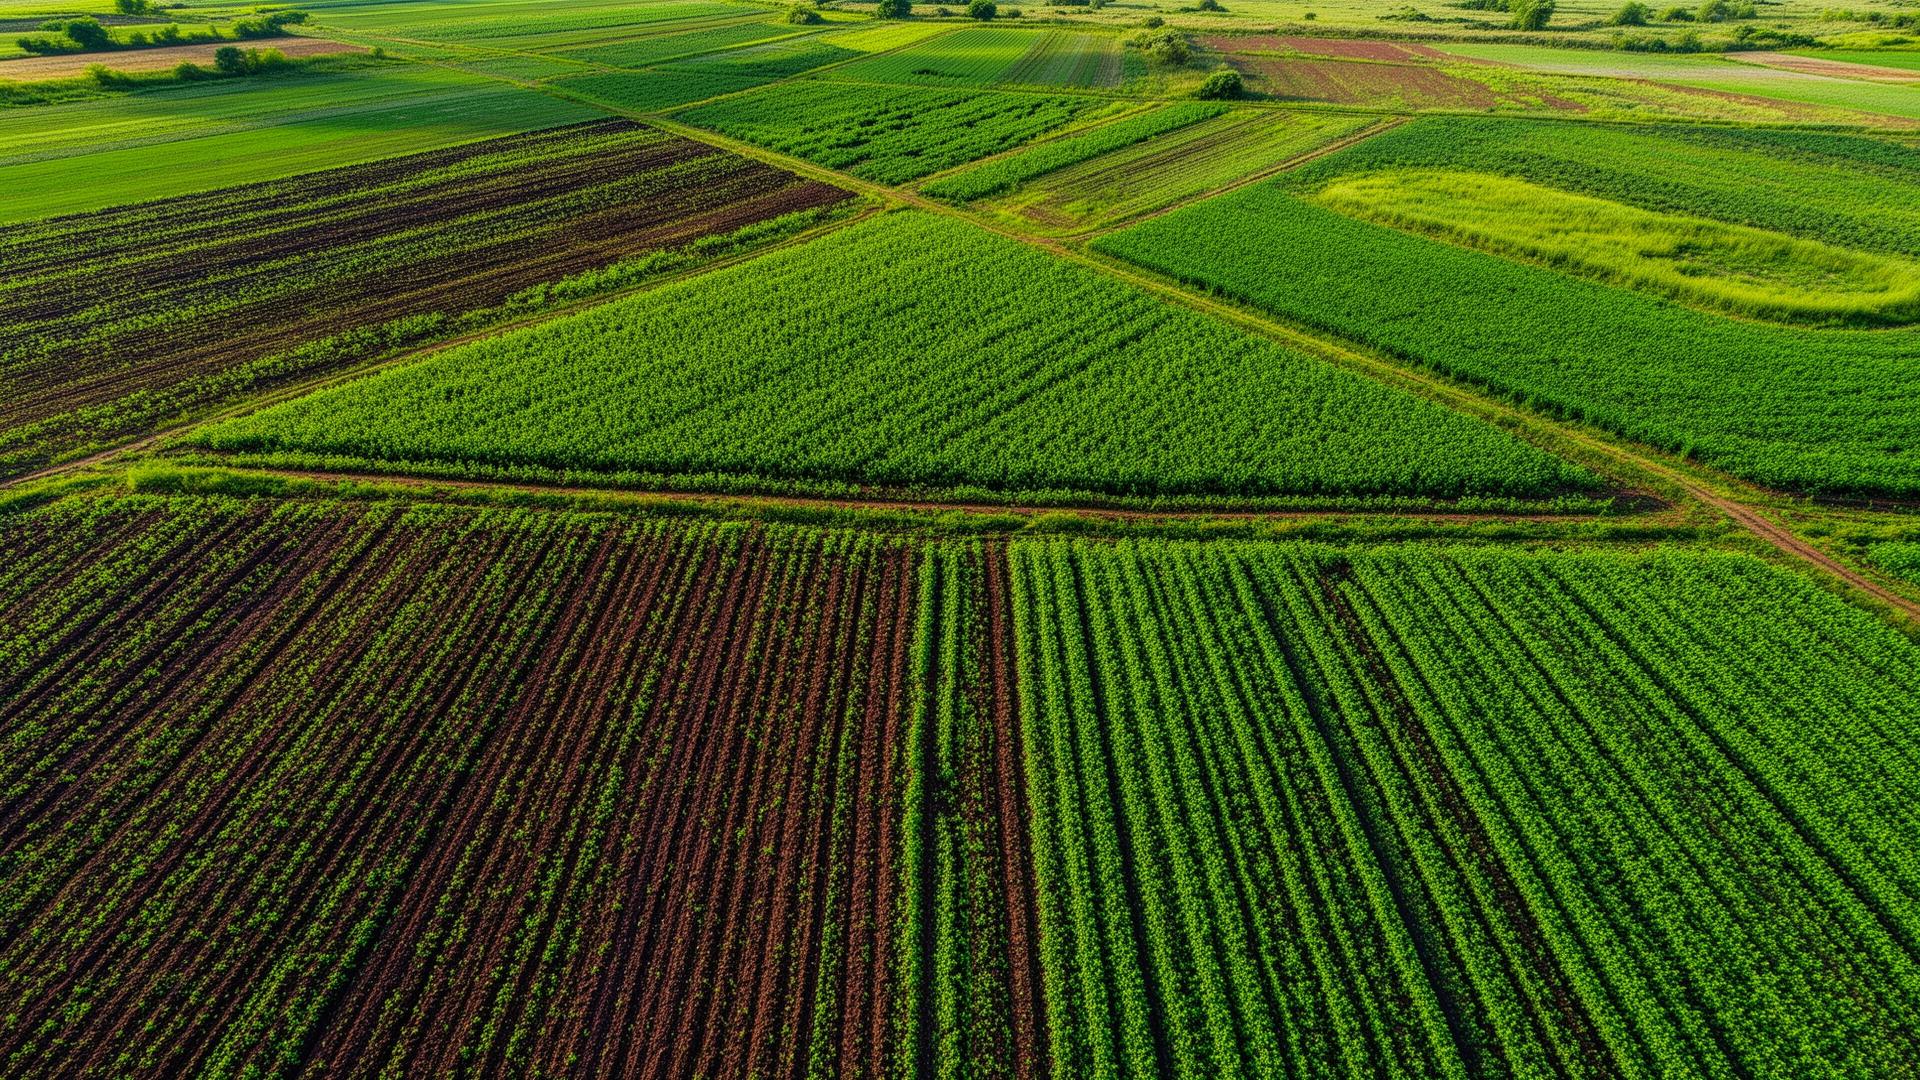
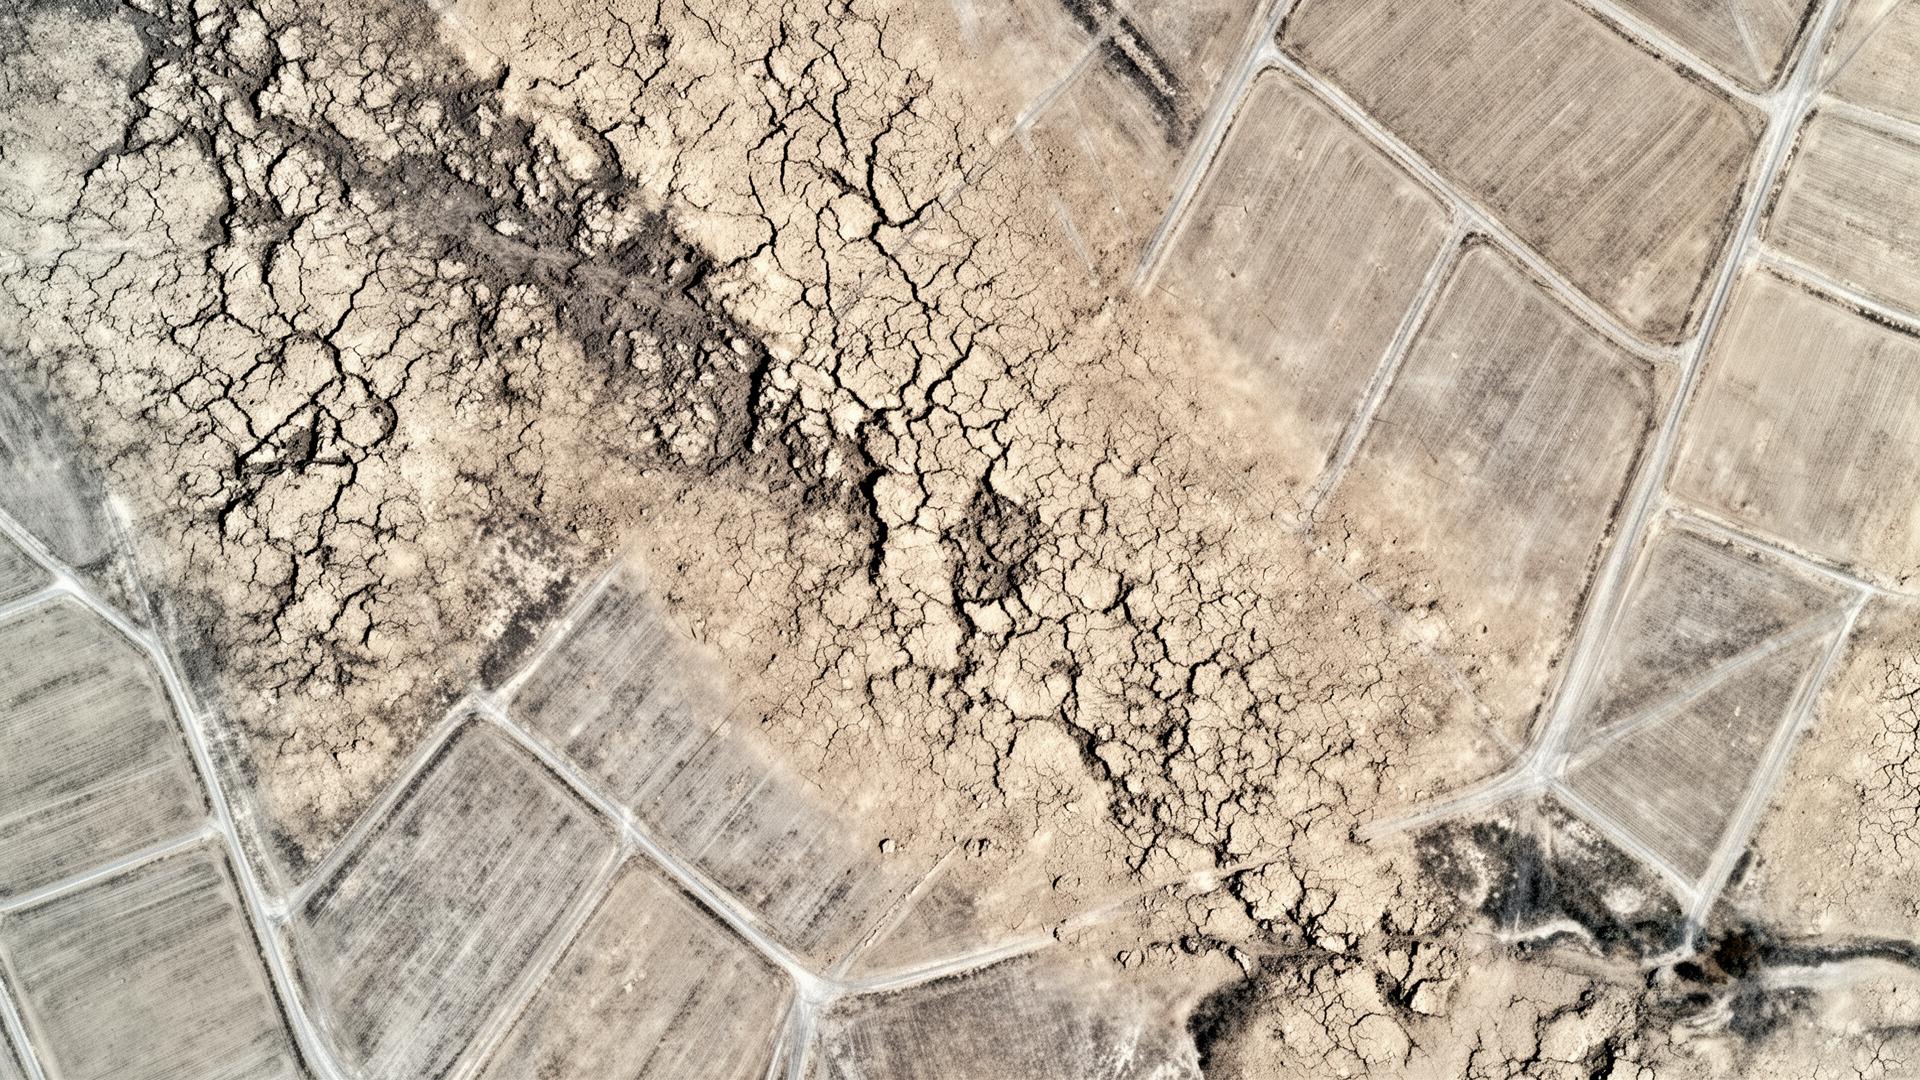
Before / after
The same hectare. Three growing seasons apart.
Drag the divider. The land on the left is what arrives. The land on the right is what compounds.
‹›
Before
After · Year 3